
Prof Manalo
This research, conducted by Prof Emmanuel Manalo of the Graduate School of Education, provides neurological (brain) evidence of the higher mental processing cost involved in thinking about more abstract diagrams. In other words, it is harder for our brains to deal with more abstract diagrams like graphs. This finding has important implications especially for science education and the development of graphic literacy.
Background
Diagrams, such as illustrations, charts, tables, graphs, and other forms of visual representation, are generally considered more efficient in communicating information than words and sentences. The reason is that diagrams bring together the important components of the information and make explicit the connections between them. Thus, using diagrams can make it easier for people to understand information.
But are some diagrams difficult for our brains to think about? Research has previously shown that many students tend not to use diagrams in problem solving when the diagram they have to use is more abstract -- such as a graph or table. Likewise, students tend to ignore more abstract diagrams when reading pages containing both text and diagrams.
Just to clarify: more abstract diagrams here refer to diagrams that do not show information as they might look like in real life. For example, graphs represent information as points or bars, and where such information lie horizontally and vertically needs to be understood for the information to make sense. In contrast, other diagrams are more concrete because they show information more or less as they might look in real life. For example, an illustration or sketch might show the locations of buildings that lie in a particular area, or the different parts of a lock-and-key system.
For some time, there has been behavioral evidence suggesting that more abstract diagrams are more demanding of brain resources -- but no evidence in terms of what actually happens in the brain.
Research method(s) and outcome(s)
Now, Professor Emmanuel Manalo (Graduate School of Education), in collaboration with Drs Theo van Leeuwen and Jan van der Meij from the University of Twente in the Netherlands, have obtained evidence showing that there is higher brain activity when people are dealing with more abstract diagrams. Their study was recently published in the journal, Mind, Brain, and Education .
In the study, they showed students different representations of the same information (pictures/illustrations, equations, tables, graphs) and measured the resulting activity in the students' brains. They used a subtraction method to control for the amounts of detail in the information shown. They found much higher activity in the students' brains when they were looking at graphs -- which were the most abstract of the representations shown.
Ripple effects
This study is important because it is the first to provide neurological (brain) evidence that the way information is shown affects the processing demand on the brain. In simple terms, more abstract information is harder for the brain to deal with.
Developing learners' abilities to understand and use diagrams is very important in education. The findings from this research emphasize the importance of focusing particularly on cultivating students' knowledge about and skills in using more abstract diagrams.
In media communication, diagrams are also very important. The findings of this research suggest caution and careful consideration concerning what diagrams to use. For example, diagrams used to supplement text information must be sufficiently easy for the intended audience to understand. Otherwise, if the diagrams tax the brain too heavily, they could be misunderstood or simply ignored.
Future plan
Professor Manalo plans to investigate the effect of providing students with training in diagram construction -- whether such training would increase spontaneous use of diagrams in problem solving and communication, and whether it would reduce the cognitive cost associated with diagram construction (as measured by associated brain activity).
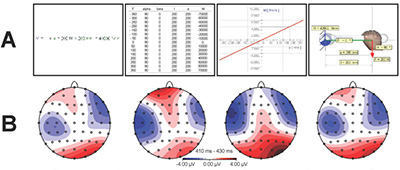
Figure: Row A shows examples of the information shown to student participants, and Row B shows the corresponding brain activity in the P3b segment (in electroencephalogram recordings, or EEG). The graph (third from the left) elicited stronger brain responses compared to the other representations.
Paper Information
[DOI] http://dx.doi.org/10.1111/mbe.12064
Theo H. van Leeuwen, Emmanuel Manalo and Jan van der Meij
"Electroencephalogram Recordings Indicate That More Abstract Diagrams Need More Mental Resources to Process"
Mind, Brain, and Education Volume 9, Issue 1, pages 19–28, March 2015


